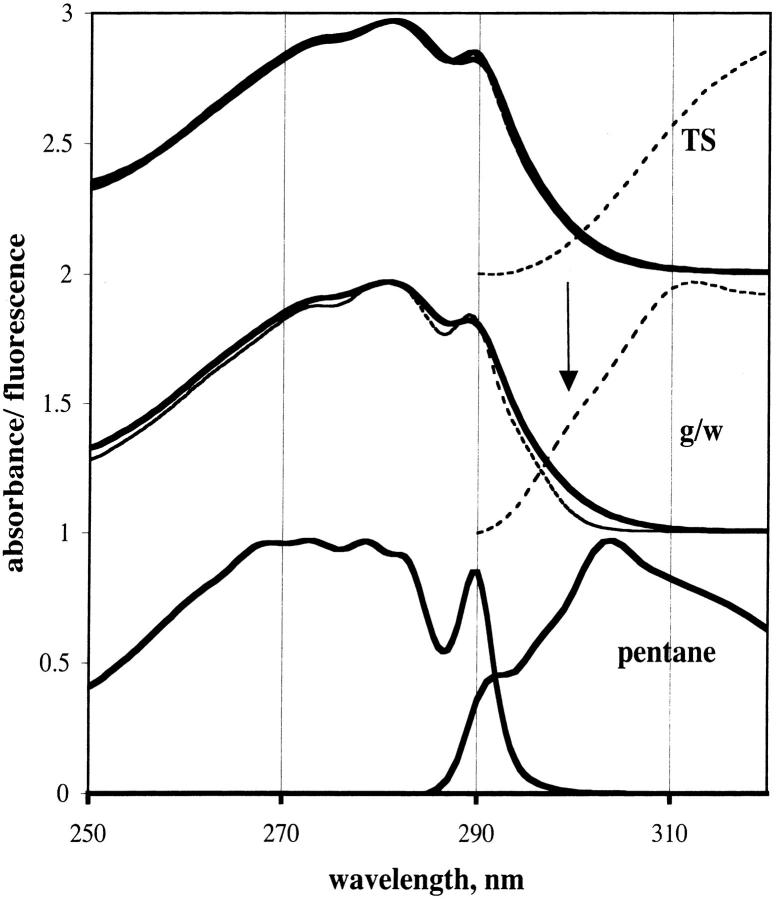
FIGURE 9.
Spectra of indole compounds. (Upper) NATA in TS film; (middle) NATA in glycerol/water; (bottom) 3-methyl indole in n-pentane. Solid lines, 290 K; dotted lines, 20 K. Spectra to the left are absorption spectra; spectra to the right are fluorescence spectra. Emission band-pass, 2 nm. Arrow indicates the position of a shoulder.

