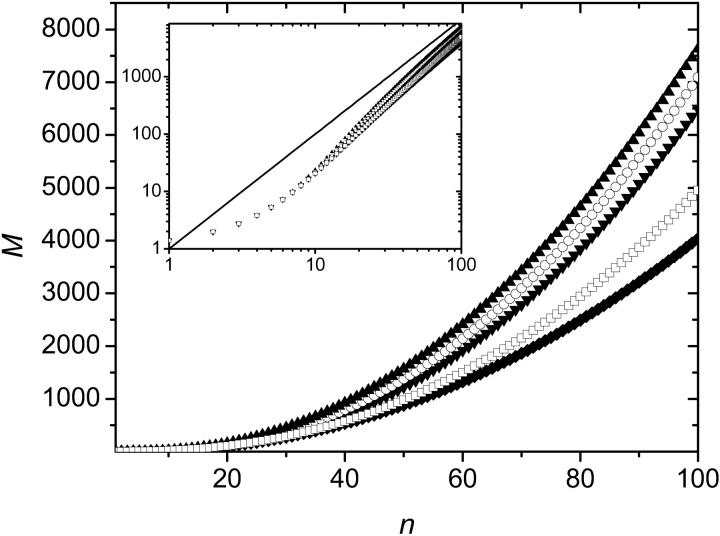
FIGURE 15.
Average size M of the colony as a function of the number n of cycles for d = 0%, 1%, 5%, 10%, and 20%, where d is the probability that a molecule makes a copy on an interstitial site. For each set of data the results were averaged over 100,000 colonies and p = 0.4 was used. Inset: Same data on a log-log graph. All curves are now almost undistinguishable. The solid line corresponds to a geometrical growth and has a slope of 2.

