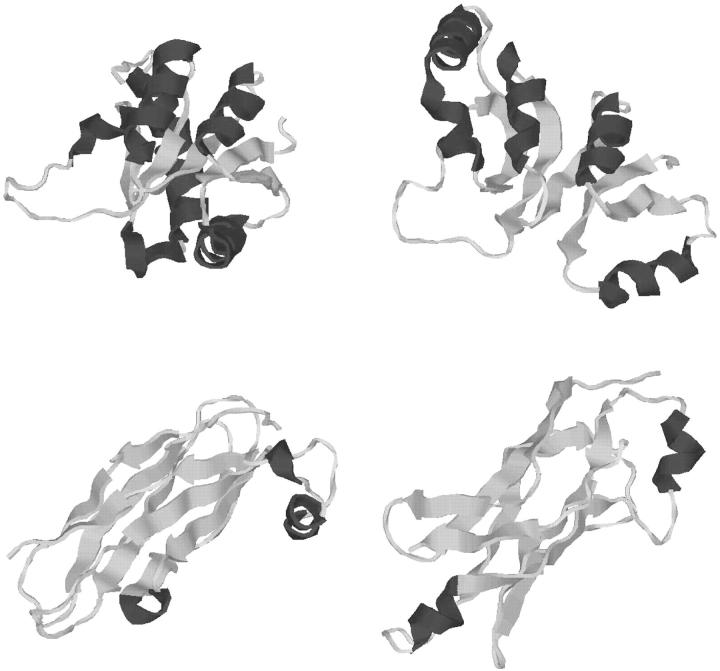
FIGURE 18.
Comparison of predicted lowest energy tertiary structure (left) and experimentally determined structure (right) for T138 and T160 (top to bottom). All images generated with the RASMOL molecular visualization package (Sayle and Milner-White, 1995).

