FIGURE 1.

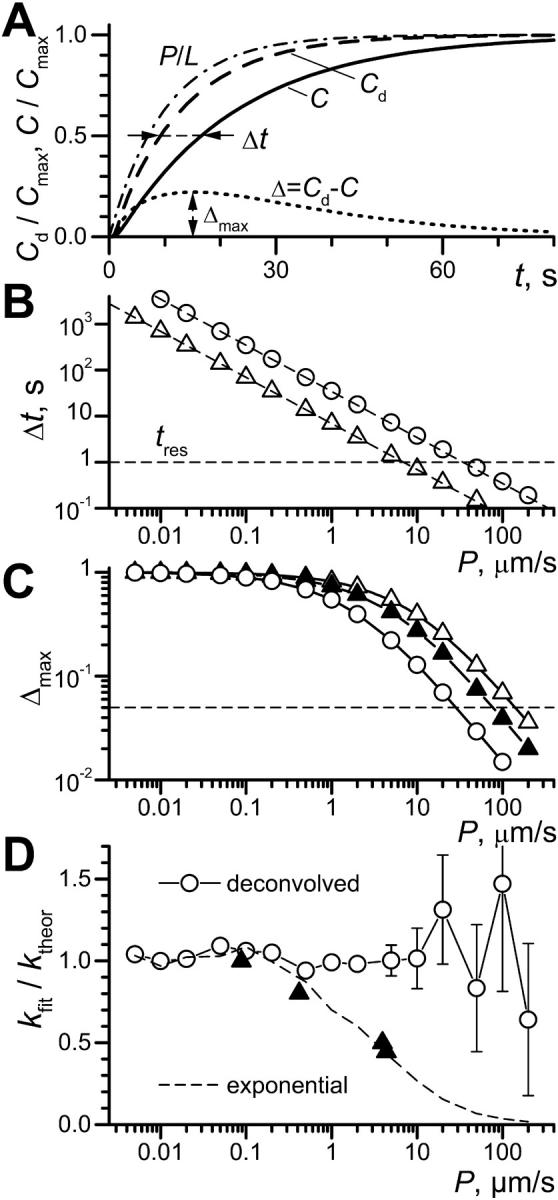
Refined theoretical description of OSTR experiments. (A) Example of calculated substrate concentration kinetics. Length of test compartment, L = 50 μm; observation at x = 30 μm; concentration in the chamber changed instantaneously from 0 to Cmax at t = 0. Curve P/L (dash-dot line): pure permeation or membrane transport (D→∞, P = 5 μm/s; calculated according to Eq. 6 for k = P/L = 0.1 s−1). Curve Cd (dashed line): pure diffusion (diffusion coefficient D = 80 μm2/s, permeability coefficient P→∞). Curve C (solid line): convolution of membrane transport and diffusion (D = 80 μm2/s, P = 5 μm/s). Horizontal arrows: difference between halftimes of permeation and diffusion Δt; vertical arrows: Δmax, the maximum of the difference Δ = C − Cd (dotted line). (B) Dependence of Δt (see A) on P for TCs of 50-μm length (○) and 10-μm length (▵). Dashed lines represent function ln(2)L/P. Horizontal dashed line indicates an experimental time resolution tres = 1 s. (C) Dependence of Δmax (see A) on P for TCs of 50-μm length (○) and 10-μm length (▴, ▵). A level of 5% amplitude resolution is indicated by the dashed line. Solid triangles show data for diffusion and permeation curves in 10 μm TC both convolved with idealized exponential solution exchange 1–exp(−kst), ks = 1 s−1. (D) From pairs of curves simulated with ktheor = P/L (see text) the membrane transport rate constants kfit were recovered either by deconvolution (○) or by a simple exponential fit (dashed line). Experimentally obtained ratios of k-values for exponential and deconvolution fits are plotted for each transport substrate by solid triangles (data from Table 1).
