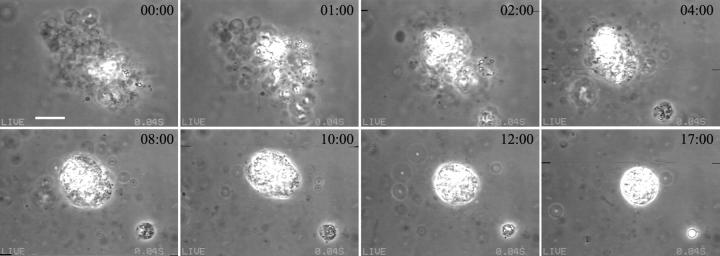
FIGURE 5.
Sequence of pictures from a condensing vesicle cluster attacked by 0.5 U/ml PLCBc in 1 mM CaCl2 at 37°C. The first snapshot was taken ∼1 h after enzyme injection. The time is written on each figure (min:s). The bar on the first image corresponds to 10 μm. A small cluster separates early on. Note the formation of two spherical compact shapes at large times, indicating fluidity of the newly formed lipid phase.

