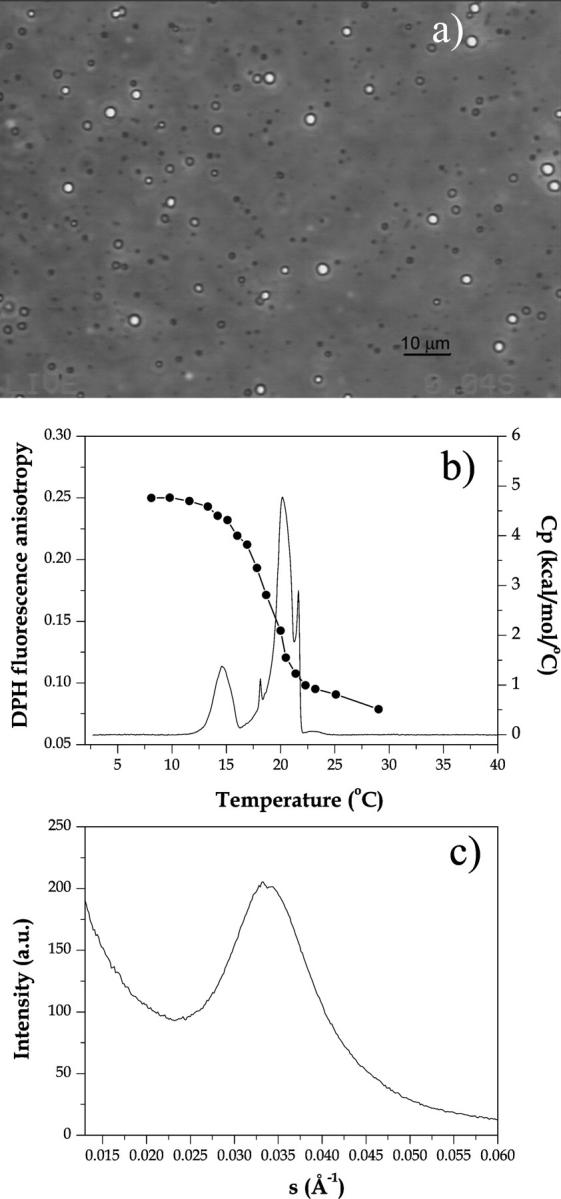
FIGURE 6.

Characterization of the end product of the reaction 0.5 U/ml PLCBc on 1 mM SOPC in 10 mM HEPES + 0.5 mM CaCl2 for ∼2 h at 37°C. The total lipid consumption was ∼80% as measured with the phosphate assay. (a) A phase contrast image of reaction end product on coverslip. (b) Fluorescence anisotropy of 0.5 mol % DPH incorporated in SOPC before the enzymatic reaction (connected filled symbols) and differential scanning calorimetry (full line) acquired at 20°C/h (enthalpy ΔH = 13 kcal/mol). (c) Small angle x-ray scattering acquired at 25°C. The condition for the SAXS measurements was slightly different, since much more lipid was needed for a good signal/noise ratio: 3 U/ml PLCBc on 50 mM SOPC in 10 mM HEPES + 3 mM CaCl2 for ∼2 h at 37°C
