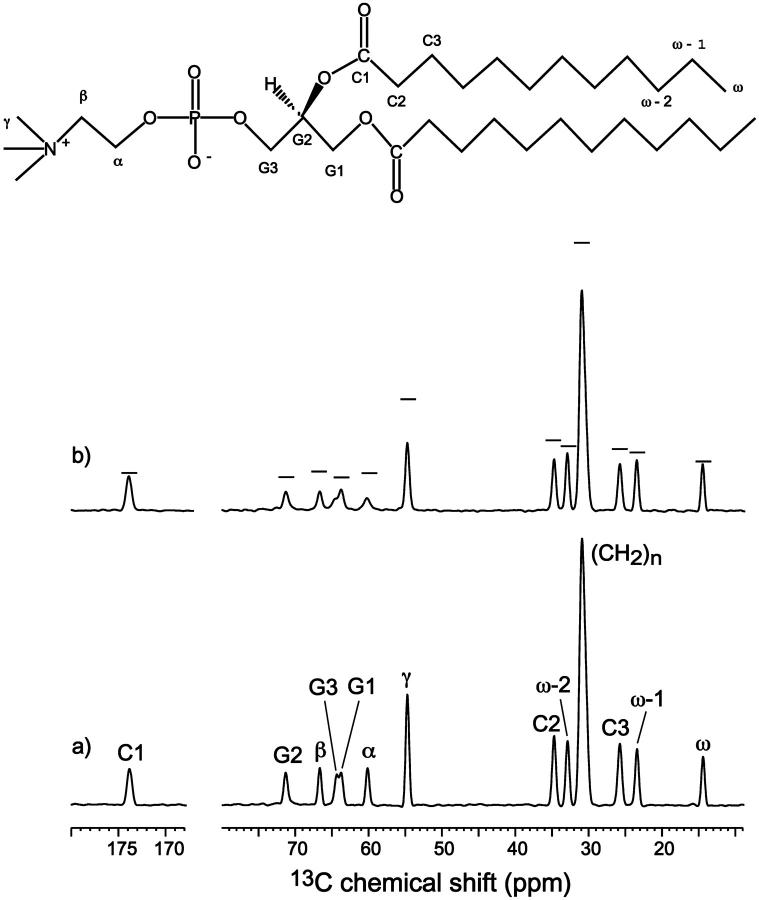
FIGURE 2.
13C direct-polarization MAS spectra of DLPC. (a) Without Mn2+; (b) with 12 mol % Mn2+. Peak assignment is indicated, along with the structure and nomenclature of DLPC lipids. Horizontal bars in b denote the heights of the corresponding peaks in the Mn2+-free control sample. Note the increasing amount of signal reduction from the acyl chain end to the glycerol region.

