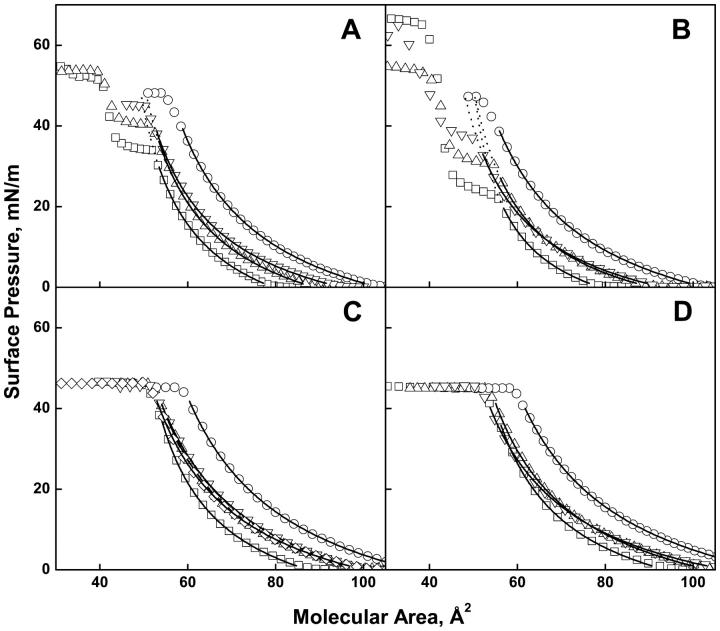
FIGURE 1.
Surface pressure-molecular area isotherms of phosphoglycerides at the argon-buffer interface. (Panel A) PO series; (B) SO series; (C) SA series; (D) SD series. In all panels; PA (□), PE (▵), PC (○), PS (▿), PI (◊). Solid lines show range over which data were fit to Eq. 1; dotted lines show extrapolations of fitted curves to the collapse pressure of PC for species that did not collapse directly from the liquid-expanded state.

