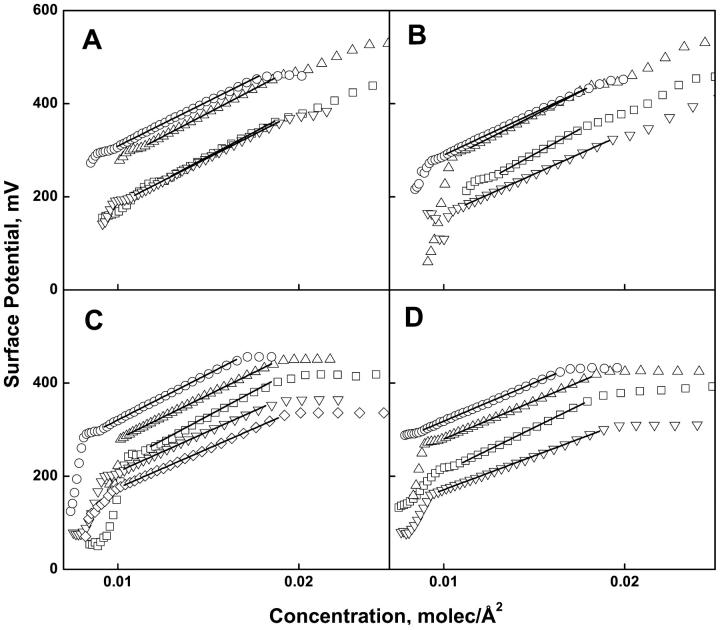
FIGURE 4.
Surface potential-concentration isotherms of phosphoglycerides at the argon-buffer interface (acidic phosphoglycerides with 1.0 mM Mg2+). Panel (A) PO series; (B) SO series; (C) SA series; (D) SD series. In all panels; PA (□), PE (▵), PC (○), PS (▿), PI (◊). Solid lines show fits to Eq. 2 over the range of data shown by the solid lines in Fig. 1.

