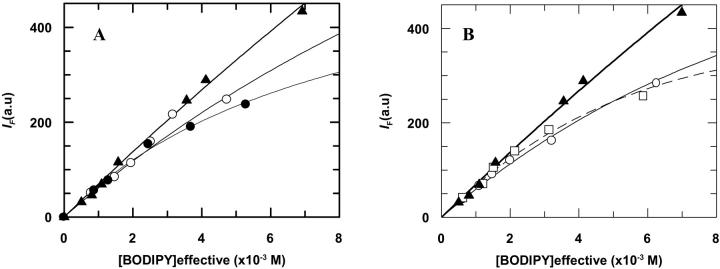
FIGURE 2.
Fluorescence steady-state data for BODIPY fluorescence self-quenching at different labeled protein concentrations. (A) Protein incorporated in DOPC (▴); DMoPC/DOPC (60/40 mol/mol) (○); and DEuPC/DOPC (60/40 mol/mol) (•). Eq. 6 is fitted to the data on the basis of dynamical quenching and a sphere-of-action quenching model (14.4 Å of radius) (—) for the protein in all lipid systems. (B) Protein incorporated in DOPC (▴); DMoPC (○); and DEuPC (□). Eq. 6 fit of data from DOPC bilayers using a sphere-of-action radii of 14 Å (–), from DEuPC bilayers with a sphere-of-action radii of 27 Å (- - -), and from DMoPC bilayers using a sphere-of-action of 23 Å (–). These higher values are evidence of aggregation. See text for details.

