
FIGURE 13.
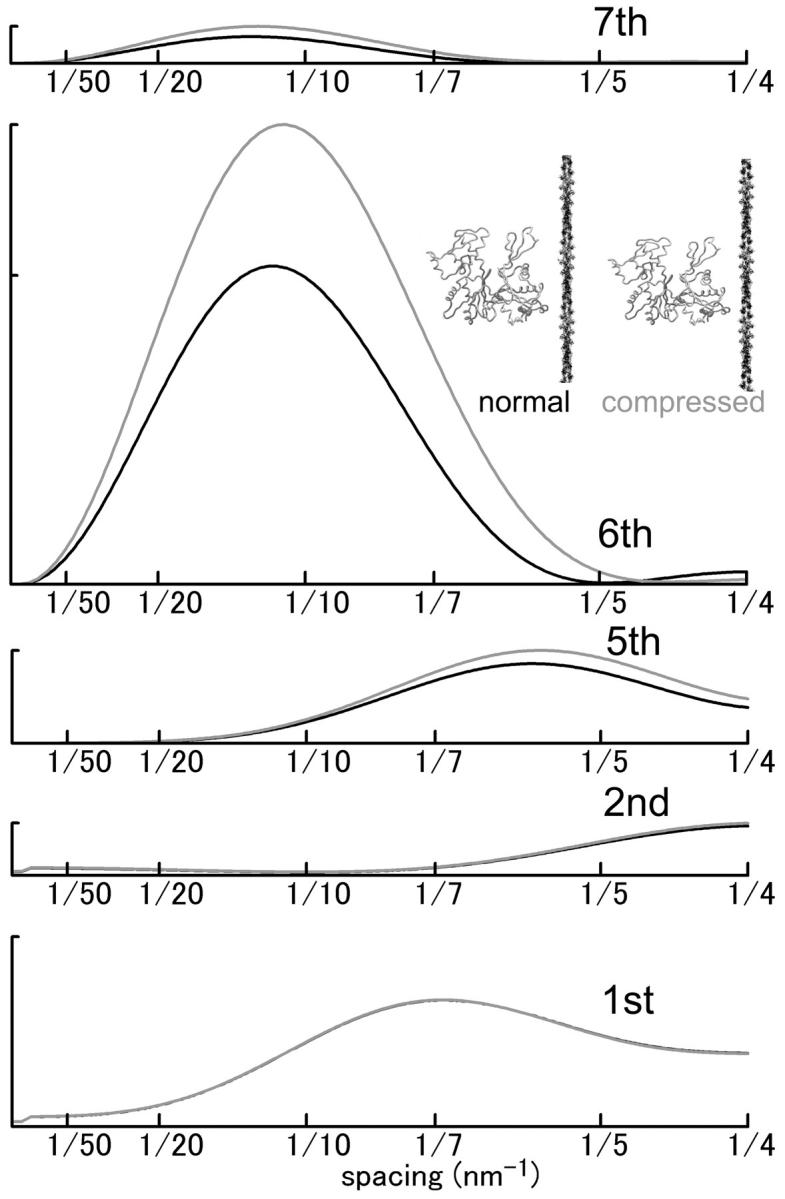
Effect of actin structural change on the intensity profiles of ALL's calculated from atomic coordinates of an actin filament. (Black curve) Normal actin filament (identical to the light gray curve in Fig. 1). (Gray curve) Actin filament in which each actin monomer is compressed by 10% in axial direction. The repeat of the monomers is unchanged. Note that the 5th, 6th, and 7th ALL are enhanced by the compression whereas the 1st ALL is not affected. The intensity in arbitrary unit and the scale is the same for all ALL's.