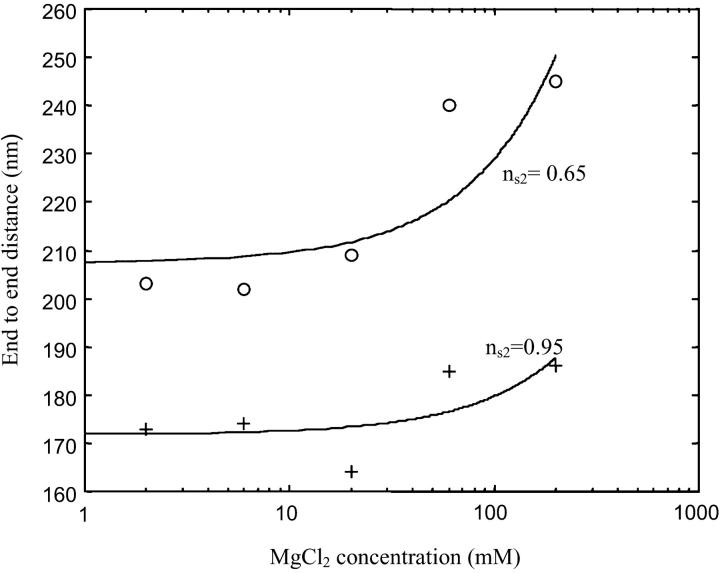
FIGURE 8.
End-to-end distances for different buffers versus Mg2+ ions concentration: (top trace) ns2 ≅ 0.95 obtained for six different buffers: [MgCl2] = 2 mM and [NaCl] = 5 mM; [MgCl2] = 6 mM and [NaCl] = 9 mM; [MgCl2] = 20 mM and [NaCl]= 15 mM; [MgCl2] = 60 mM and [NaCl] = 30 mM; [MgCl2] = 200 mM and [NaCl] = 50 mM. (Bottom trace) ns2 ≅ 0.65 obtained for six different buffers: [MgCl2] = 2 mM and [NaCl] = 50 mM; [MgCl2] = 6 mM and [NaCl] = 90 mM; [MgCl2] = 20 mM and [NaCl] = 150 mM; [MgCl2] = 60 mM and [NaCl] = 300 mM; [MgCl2] = 200 mM and [NaCl] = 500 mM. The error bar of the end-to-end measurements is about ± 30 nm and can hardly be improved by increasing the number of observed molecules. The experimental values of the end-to-end distances have been fitted by a polynomial function to observe the evolution of the end-to-end distances. We observe that the end-to-end distances appear to be nearly constant at low ionic strength for a given value of ns2. However, for the high ionic strength (I ≥ 0.1 M), the end-to-end distances are slightly larger for both ns2 = 0.95 and ns2 = 0.65.

