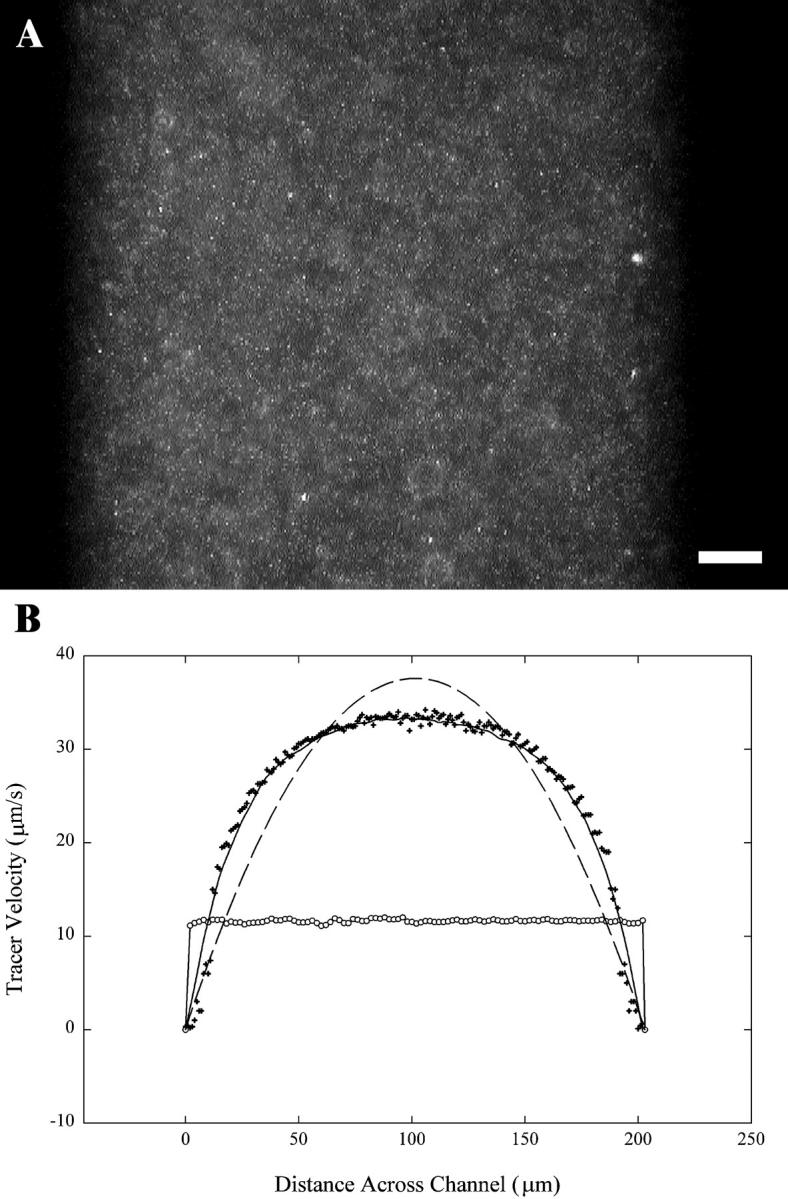
FIGURE 1.

(A) Epifluorescent image of a typical PIV experiment. 0.3-μm fluorescently labeled particles undergoing electro-osmosis and electrophoresis are traced through a 200-μm-wide channel at 8 V/cm. The scale bar is equal to 20 μm. (B) Velocity profiles of the tracer beads in an uncoated channel (+) and coated channel (○). The dashed line is a parabolic fit to the PIV data in an uncoated channel, and the solid line is the result of a finite element model for pressure flow in a rectangular channel.
