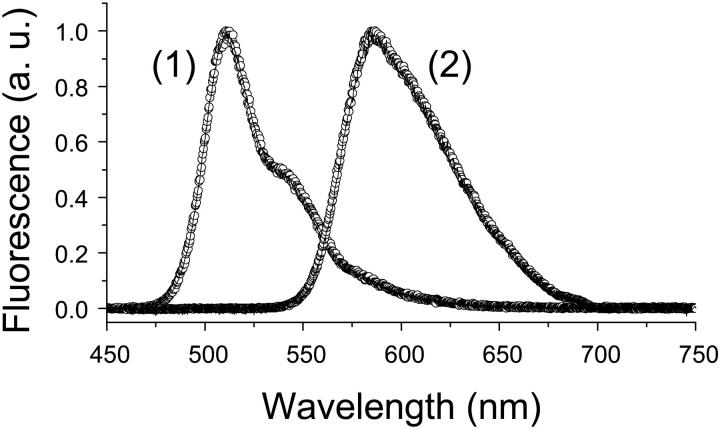
FIGURE 2.
The cellular environment does not significantly affect the 2P-emission spectra of EGFP and DsRed (either in the cytoplasm or anchored to the inner leaflet of the plasma membrane). Representative fluorescence emission spectra of EGFP (curve 1) and DsRed (curve 2) in the RBL cytoplasm (circles) and in solution (pH 7.2, lines) using λx = 970 nm. The 1P-fluorescence emission of LynB-DsRed is slightly red-shifted (∼4 nm) in subcellular environments compared with that in solution. These spectra were not corrected for the wavelength sensitivity of the fiber, spectrometer grating, or the CCD camera.

