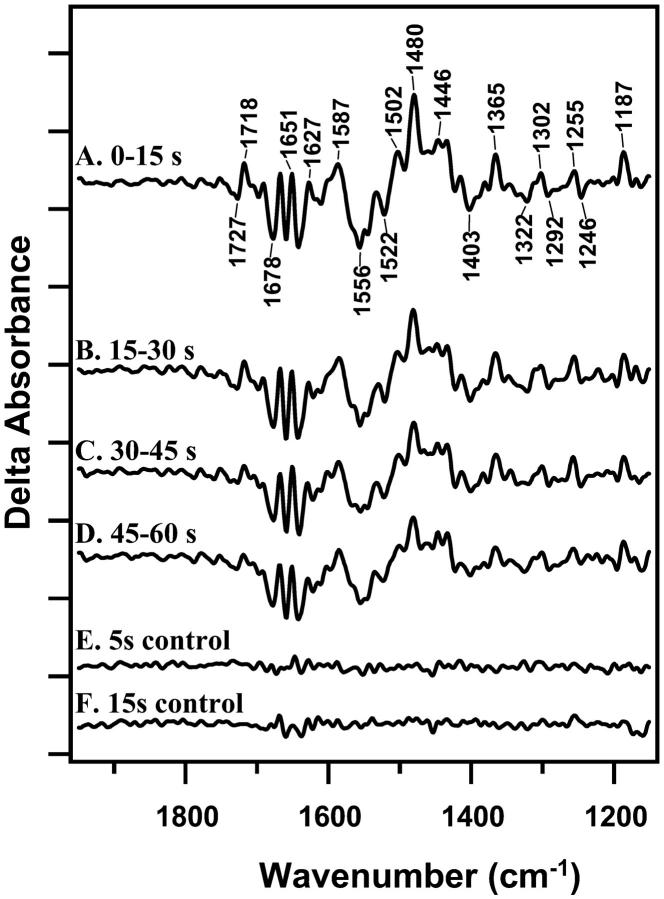
FIGURE 1.
Light-minus-dark difference FT-IR spectra, associated with S2QB−-minus-S1QB at 4°C. Difference spectra were constructed from data acquired immediately before the actinic flash and data acquired 0–15 s (A); 15–30 s (B); 30–45 (C); and 45–60 s (D) after the actinic flash. Samples were preflashed 2 h before the actinic flash to preset PSII centers in the S1 state. E shows a control spectrum constructed with 5 s of data obtained before the actinic flash. F shows a control spectrum constructed with 15 s of data obtained before the actinic flash. To correct for the difference in data acquisition time relative to the light-minus-dark spectra, the control in E was scaled by a factor of 1.7. On the y-axis, the tick marks represent 2 × 10⁻⁴ absorbance units.

