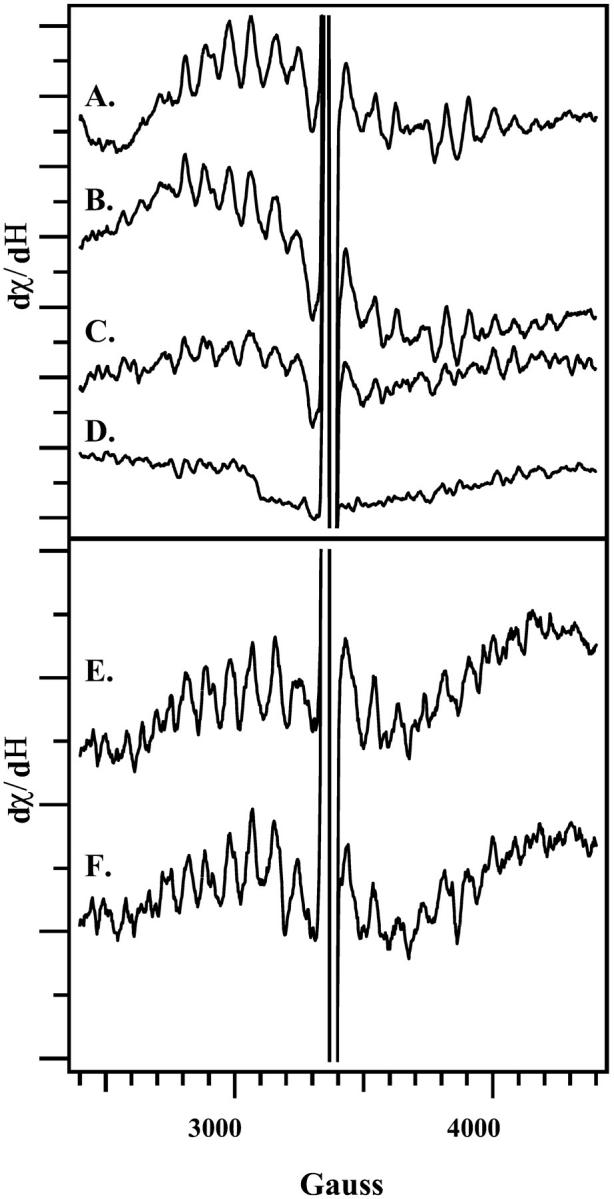
FIGURE 3.

Light-minus-dark EPR spectra, reflecting the decay of the S2 multiline signal after an actinic flash. Spectra reflect the amount of the S2 signal remaining immediately (A); 30 s (B); 5 min (C); or 20 min (D) after an actinic flash. In E and F, PSII was dark-adapted for 1 h and then preflashed at 4°C. The sample was then incubated at 4°C in the dark either for 1 h (E) or 20 min (F), flashed, and then immediately frozen. EPR samples were concentrated on Mylar and were prepared in the same manner as the FT-IR samples employed in Figs. 1 and 2.
