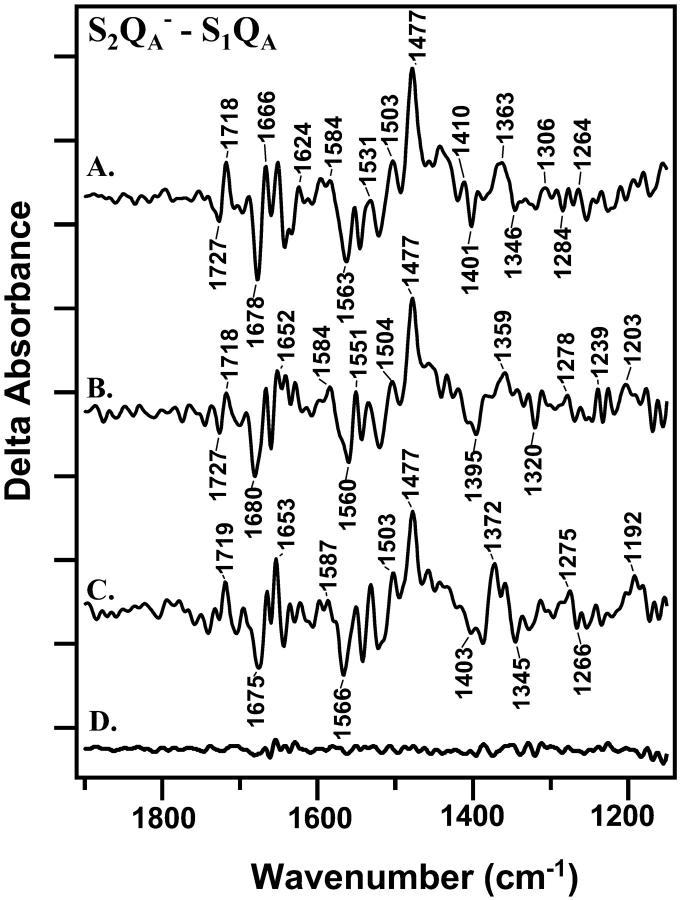
FIGURE 4.
Light-minus-dark difference FT-IR spectra, associated and S2QA−-minus-S1QA at 4°C. Difference spectra were constructed from data acquired immediately (0–30 s) after the actinic flash and data acquired immediately before the flash. In A, a preflash was given, followed by a 2-h dark adaptation before the actinic flash. In B, a preflash was given, followed by a 1-h dark adaptation before the actinic flash. In C, a preflash was given, followed by a 20-min dark adaptation before the actinic flash. D shows a control spectrum constructed with data acquired before each actinic flash. On the y-axis, the tick marks represent 2 × 10⁻⁴ absorbance units.

