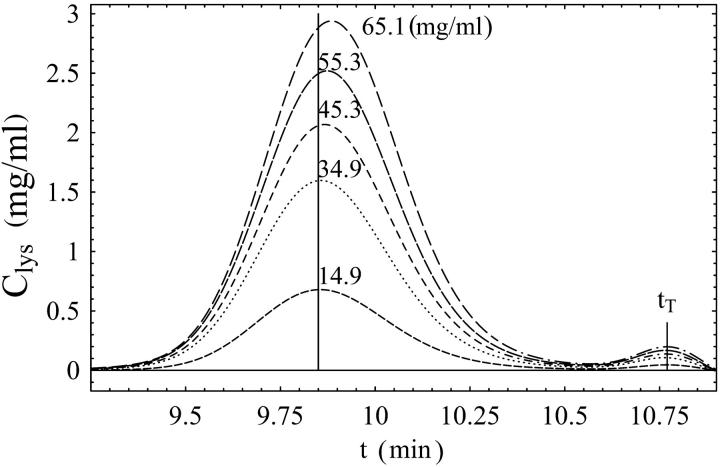
FIGURE 1.
Lysozyme chromatograms for Vinj = 20 μL and different injected concentrations (Cinj) as indicated next to each curve. The average concentrations 〈Ci〉 are 0.74 mg/mL (dash); 1.72 mg/mL (points); 2.20 mg/mL (dash and points); 2.68 mg/mL (long dash); 3.08 mg/mL (long dash and points). The vertical line marks the retention time for the most dilute sample (not shown). The retention time tr is the time corresponding to the peak of the concentration profile (Cmax) and increases with increasing concentration. The retention time of completely included molecules (the “total” volume) is marked as tT and is caused by the buffer. The retention time of completed excluded molecules (the “dead” volume) was t0 = 6.07 min (not shown). Cmax and 〈Ci〉 are similar. Buffer: sodium acetate, 50 mM, pH 4.7.

