
FIGURE 2.
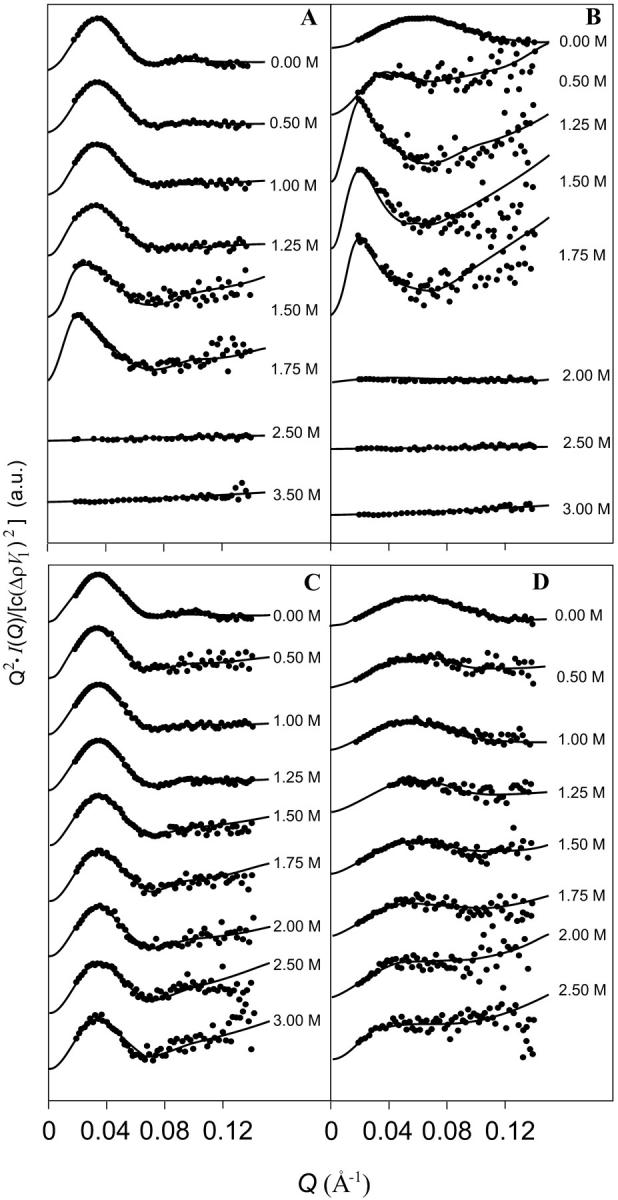
Kratky plots of Carcinus aestuarii Hc in the presence of increasing concentrations of GuHCl (A and B) or NaCl (C and D), as indicated (derived from the SAXS data shown in Fig. 1). For sake of clarity, traces are shifted along the y-axis. Protein samples: A and C, hexameric Hc in the holoform; B and D, CaeSS2 subunit in the holoform. Fitting curves are obtained with the global fitting analysis based on the thermodynamic model of association/unfolding processes.