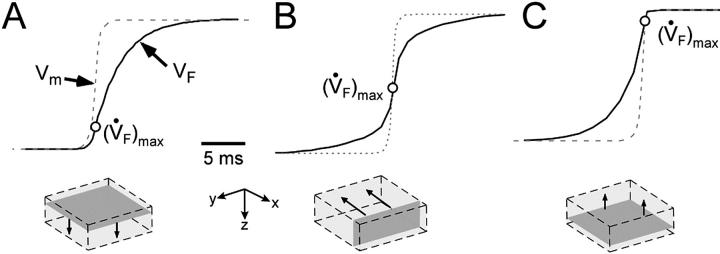
FIGURE 4.
OAP upstroke morphology as a function of the direction of transmural propagation (see diagrams below each plot). (A) Propagation away from the recording surface; (B) propagation perpendicular to the recording surface; and (C) propagation toward the recording surface. Open circles on the OAP upstrokes indicate (the Fenton-Karma ionic model) locations of ( )max. Electrical upstrokes are indicated by dashed lines.

