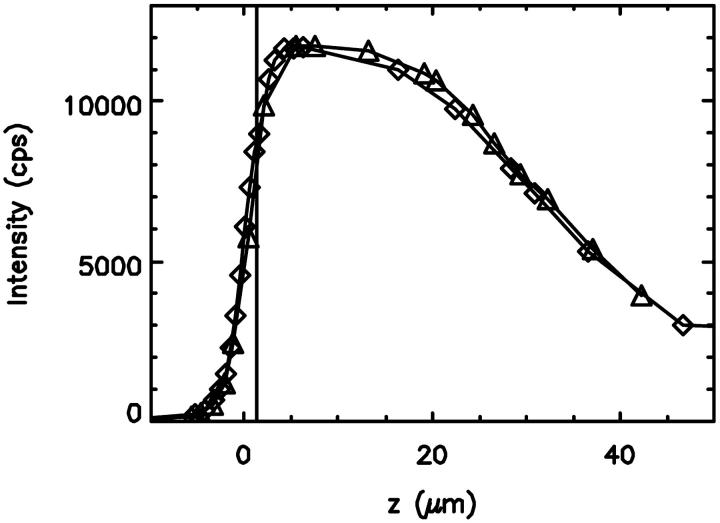
FIGURE 2.
The fluorescence intensity measured in the capillary as a function of focus depth. The first curve (⋄) was taken while focusing deeper into the capillary. The second curve (▵) was taken while moving the focus back to the starting point outside of the inner bore of the capillary. The objective was moved with a piezo stage. The fluorescence intensity initially increased as the laser focus was moved into the inner bore of the capillary, which was filled with a fluorophores solution. After reaching a maximum the fluorescence intensity decreases. The vertical line indicates the position with the largest fluctuation amplitude (see Fig. 3).

