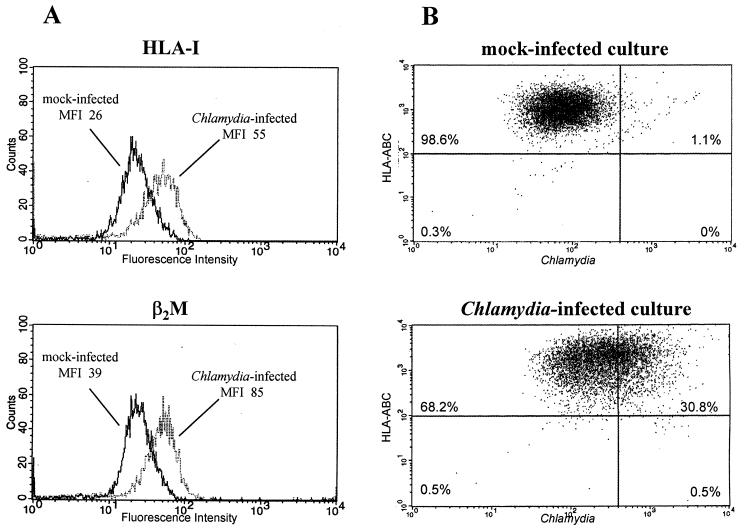
FIG. 2.
Flow cytometric analysis of HLA class I expression on fibroblasts with and without C. trachomatis infection. (A) HLA-I and β2M surface expression on cells in mock-infected and infected cultures. MFI, mean fluorescence intensity. (B) Dual-color assay for HLA-I and Chlamydia antigen expression. HLA-I-positive cells are shown in the top quadrants. Chlamydia-positive cells are shown in the right-hand quadrants. (A and B) The cells were infected with 5 × 10⁶ IFU/well and harvested 48 h after infection. Results are representative of three experiments.

