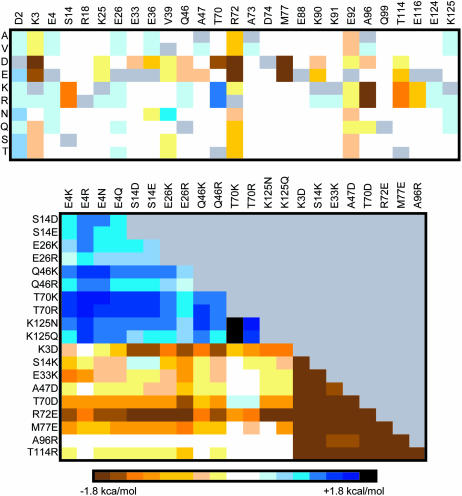
FIGURE 6.
Mutant stability screening matrix of CheY single and double mutants. Each solvent-exposed position varying between the mesophilic and thermophilic CheY sequences are systematically mutated to ten different amino acid identities. The list of double mutants screened is generated from 14 potentially stabilizing and 9 destabilizing single mutant structures. In each cell, the color hue represents the  (kcal/mol).
  values between +0.3 and −0.3 kcal/mol are colored white, each subsequent darker color represents 0.3-kcal/mol increments. Positive values indicate a stability increase, negative values indicate a stability decrease.

