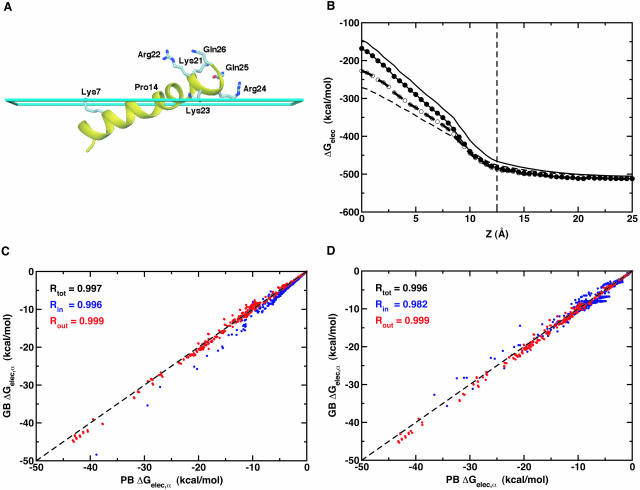
FIGURE 2.
(A) Conformation of melittin at the membrane interface (cyan slab at z = 12.5 Å), which was graciously provided by S. Bernèche and B. Roux (Bernèche et al., 1998). Some hydrophilic residues are shown as labeled ball-and-stick models. The figure was produced with DINO (Philippsen, 2001). (B) Electrostatic solvation energy of melittin in the presence of a planar membrane with 25 Å thickness (dashed thin line at z = 12.5 Å) as a function of the position of its center of mass along the z direction. The planar membrane is centered at z = 0. The line types are the same as used in Fig. 1. For C and D, Comparison of PB and GB self-electrostatic free energy, ΔGelec, α, in melittin for six different locations of its center of mass along the z-direction: z = 0, 5, 10, 15, 20, and 25 Å. GB results with 50 radial integration points are compared with PB results calculated using ɛm = 1 in C, where ΔGelec,α is colored differently with the correlation coefficients R, depending on atomic positions; atoms inside the membrane are blue and atoms outside the membrane are red. In D, GB results with 24 radial integration points are compared with PB results calculated using ɛm = 2 with the same color scheme as used in C.

