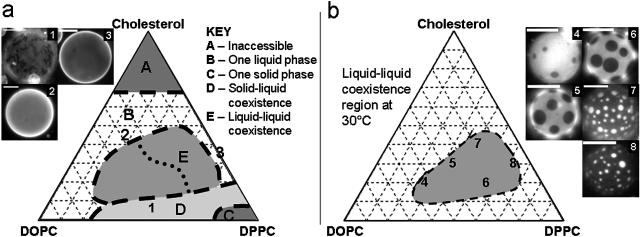
FIGURE 2.
(a) Sketch of the first phase separation observed in GUVs (if any) as temperature is lowered from a high temperature, one-phase region (see text). This is not a phase diagram since the boundaries are not at a particular temperature. Region E contains vesicles in which a liquid-liquid immiscibility transition is observed. (b) Observed phase diagram of micron-scale liquid immiscibility region in GUVs at 30°C. Compositions of vesicles in micrographs 1–8 are as follows: 1), 1:1 DOPC/DPPC + 5% Chol; 2), 2:1 DOPC/DPPC + 45% Chol; 3), DPPC + 40% Chol; 4), 2:1 DOPC/DPPC + 20% Chol; 5), 1:1 DOPC/DPPC + 30% Chol; 6), 1:2 DOPC/DPPC + 20% Chol; 7), 1:2 DOPC/DPPC + 40% Chol; and 8), 1:9 DOPC/DPPC + 30% Chol. All scale bars are 20μm. Vesicles 4–8 were imaged at 30 ± 1°C, and domains are not at equilibrium sizes.

