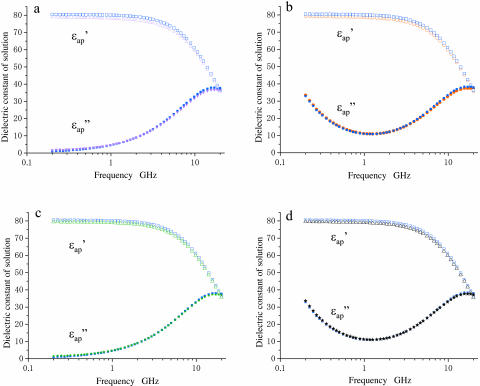
FIGURE 2.
Dielectric spectra of actin and myoglobin solutions. Unfilled and solid symbols refer to the real and imaginary parts of dielectric spectra, respectively; blue symbols refer to buffers. (a) Spectra of actin (magenta triangles, 21.0 mg/ml) in the low-salt buffer (2 mM HEPES, 0.2 mM ATP, and 0.1 mM CaCl2, at pH7.2). (b) Spectra of actin (red circles, 13.8 mg/ml) in the high-salt buffer (2 mM HEPES, 0.2 mM ATP, 0.1 mM CaCl2, 50 mM KCl, and 2 mM MgCl2, at pH 7.2). (c) Spectra of myoglobin (green triangles/stars, 14.0 mg/ml) in the low-salt buffer. (d) Spectra of myoglobin (black triangles/stars, 13.8 mg/ml) in the high-salt buffer.

