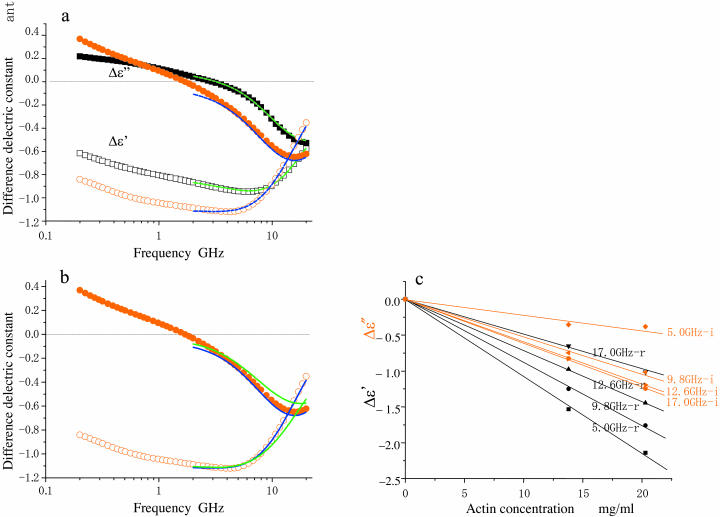
FIGURE 3.
Difference dielectric spectra of F-actin (red circles) and myoglobin (black squares) solutions. Data were obtained from eight independent measurements for both proteins, averaged as described in Materials and Methods, and normalized to a protein concentration of 10 mg/ml. The size of the spectral symbols are roughly equal to the error widths. Unfilled and solid symbols refer to the real and imaginary parts of dielectric spectra as in Fig. 2. (a) Difference spectra (Δɛ′ (f), Δɛ″(f)) to show that actin and myoglobin are distinct. The theoretical curves for myoglobin were calculated according to Yokoyama et al. (2001) and those for F-actin by analysis using the model shown in Fig. 5. (b) Comparison of fit of theoretical curves: the single-shelled model, green solid lines; the double-shelled model, blue solid lines. (c) Protein concentration-dependence of Δɛ′ (black) and Δɛ″ (red) of F-actin at the frequencies indicated.

