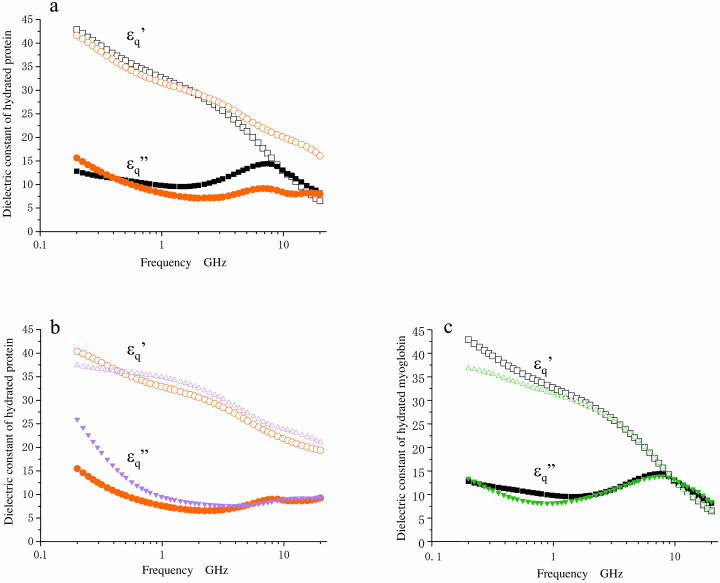
FIGURE 4.
Dielectric spectra  of hydrated F-actin and myoglobin. Unfilled and solid symbols refer to the real and imaginary parts of dielectric spectra as in Fig. 2. (a) Comparison of actin (red circles) and myoglobin (black squares) in the high-salt buffer. (b) Comparison of actin in the low-salt buffer (magenta triangles) and the high-salt buffer (red circles). (c) Comparison of myoglobin in the low-salt buffer (green triangles) and the high-salt buffer (black squares).

