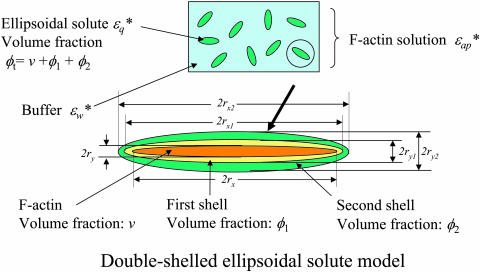
FIGURE 5.
Double-shelled ellipsoidal solute model. This model (Asami et al., 1980) was used to analyze the dielectric spectrum of F-actin solution as outlined in Materials and Methods. The expressions 2rx and 2ry refer to the lengths of major and minor axes of the ellipsoidal shells, respectively. Theoretical spectral curves obtained were superimposed on the observed values for Δɛ′(f) and Δɛ″(f) (blue-colored solid lines in Fig. 3 a). Note that when applied to the spectrum of the myoglobin solution with the protein axial ratio of 1.001, a curve essentially the same as estimated by the previous method was obtained (Yokoyama et al., 2001).

