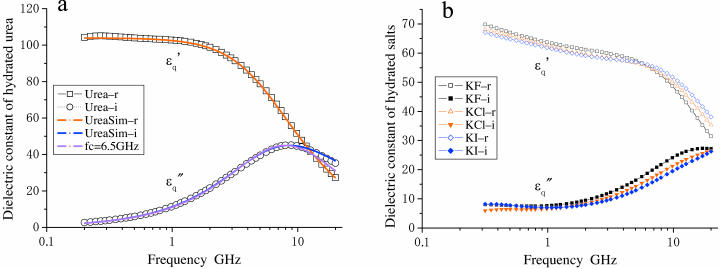
FIGURE 6.
Dielectric spectra of hydrated solutes in urea and potassium halides solutions. (a) Experimental values for urea ( squares;
  circles) measured in 2% (w/v) solution are superimposed with theoretical curves (red and blue) simulated with the two components combined together: one with fc1 = 6.5 GHz, δ1 = 110, and N1 = 2.4; and the other with fc2 = 30GHz, δ2 = 88, and N2 = 2.4 using Eqs. 1–5 and N1,2 = φ1,2Mw/18c. The magenta-colored curve is the spectrum (imaginary part) of the component with fc1 = 6.5 GHz. (b) Spectra of potassium halide salts, KF (black), KCl (red), and KI (blue) measured in 0.2 M solutions. The curves were calculated using Eq. 5 with a constant φt = 0.117, which was the largest among those of KF, KCl, and KI. The peak in
  spectra are at 18 GHz for KF, whereas the simulation indicates peaks at fc2 = 22 GHz and 25 GHz for KCl and KI, respectively.

