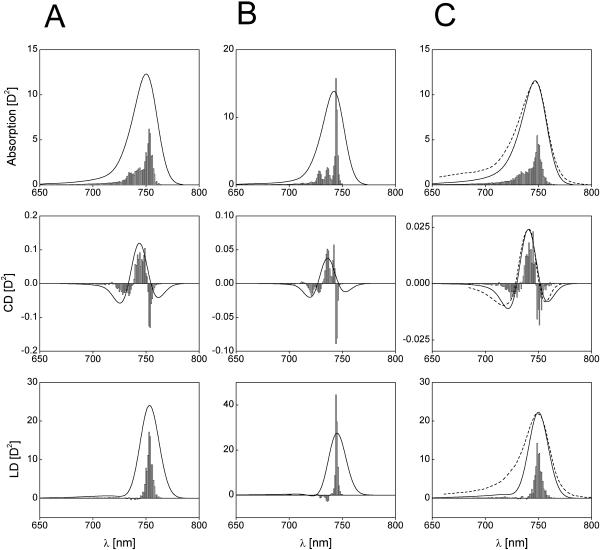
FIGURE 4.
Calculated absorption-, CD-, and LD-spectra of aggregates consisting of 40 molecules per stack with diagonal disorder (A), off-diagonal disorder (B), and in the presence of both disorders (C) (an ensemble of 50 aggregates was calculated for the disorder-spectra). The stick-spectra are convoluted with a normalized Gaussian profile of FWHM = 350 cm−1. Amplitude factor for the stick-components is 10−2. For the disorder parameters, see Table 1. Dotted lines are measured spectra from Griebenow et al. (1991). For better comparison, their amplitudes are normalized to the calculated spectra, and are shifted by 7.5 nm to the red.

