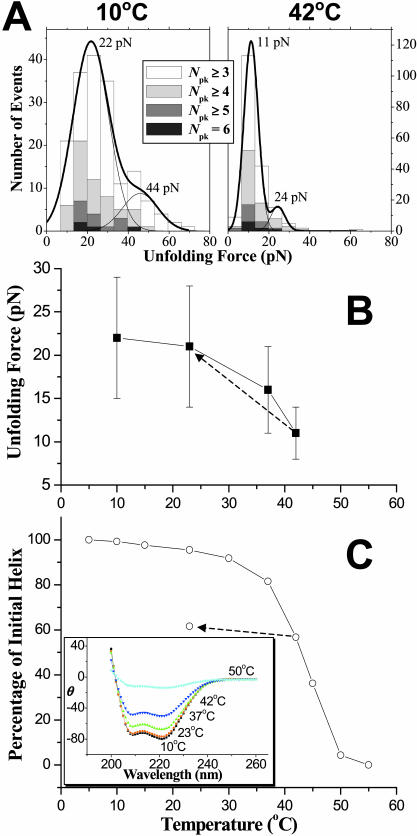
FIGURE 3.
Nonlinear temperature dependence of both unfolding force and percentage of initial helix for β1–4 spectrin. (A) Force distributions from ensembles of extension curves at 10°C and 42°C. Force distributions were fitted with two Gaussians. The major Gaussian indicates the force to unfold a single protein chain and the minor Gaussian, at about twice the force, represents unfolding of two independent chains. (B) Unfolding forces of single molecules show that the average unfolding forces decrease by half from 10°C (22 pN) to 42°C (11 pN). The dotted arrow indicates that when the sample was cooled to 23°C from 42°C, the unfolding force returns to 21 pN. (C) Percentage of initial helix versus temperature from circular dichroism. At 42°C, the percentage of initial helix is 56%. The dotted arrow indicates the effect of cooling the sample from 42°C to 23°C: the percentage of initial helix increases <10%. The unfolding forces and percentage of initial helix, nonetheless, follow the same nonlinear decrease with temperature. The inset shows CD spectra up to 55°C, where β1–4 is completely unfolded.

