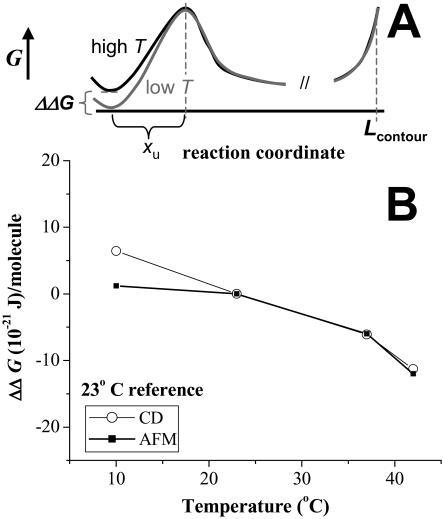
FIGURE 5.
Energetic comparison between AFM and CD. (A) Low and high temperature free energy landscapes for protein unfolding, with the unfolded state free energy used as a reference. (B) The temperature-dependent change in folding-unfolding free energy difference (ΔΔG) for both CD and AFM. 23°C is used as reference. Both calculations clearly show decreases in ΔΔG with temperature, emphasizing the increased tendency to unfold at higher temperature.

