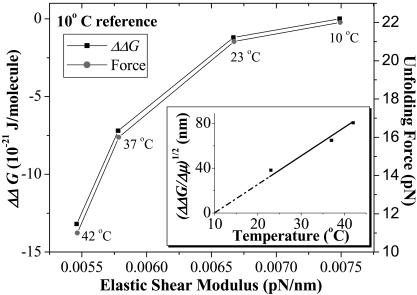
FIGURE 6.
Nonlinear correlations between the red cell's shear elastic modulus and both ΔΔG and unfolding force, F. The elastic modulus, μ, data is extracted from Waugh and Evans (1979) and plotted against ΔΔG and unfolding forces from these AFM results. The reference temperature for ΔΔG is 10°C. Each data point is labeled with the temperature at which the data was extracted. The inset shows that, with increasing temperature, the relative length (ΔΔG/Δμ)1/2 also increases, representing increased unfolding of spectrin repeats in the heated cell membrane.

