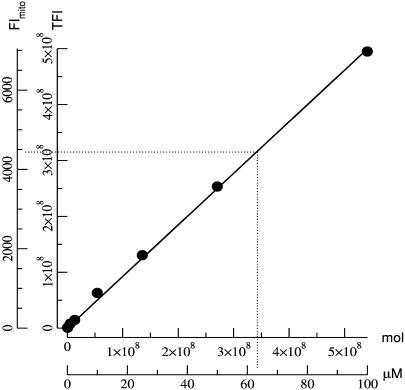
FIGURE 1.
TMRE calibration curve. Inner axes show the TFI plotted against total number of TMRE molecules. The data were fit with a straight line (R = 0.999) having a slope of 0.93 FI/molecule of TMRE. Outer axes show mitochondrial FI plotted against [TMRE] in μM. There was no evidence of self-quenching. The dashed line shows the extrapolation of [TMRE] from the mean FI.

