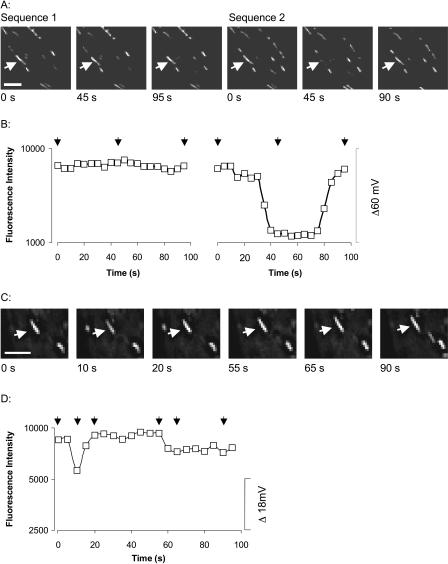
FIGURE 4.
Localized transient depolarizations of ΔΨm. A and C show a selection of images taken of two cells. Each image shows one plane of a three-dimensional image stack. The arrows point to mitochondria in which changes in ΔΨm were observed during the image sequence. A decrease in FI denotes mitochondrial depolarization. Scale bars are 5 μm. B and D are a graphical representation of the FI (on a log scale) of the mitochondria indicated in A and C. The arrows above the traces indicate the time points for which images are shown. The scale bar on the right shows the change in ΔΨm (mV). Flickers vary in amplitude, frequency, time to depolarize, and duration of depolarization.

