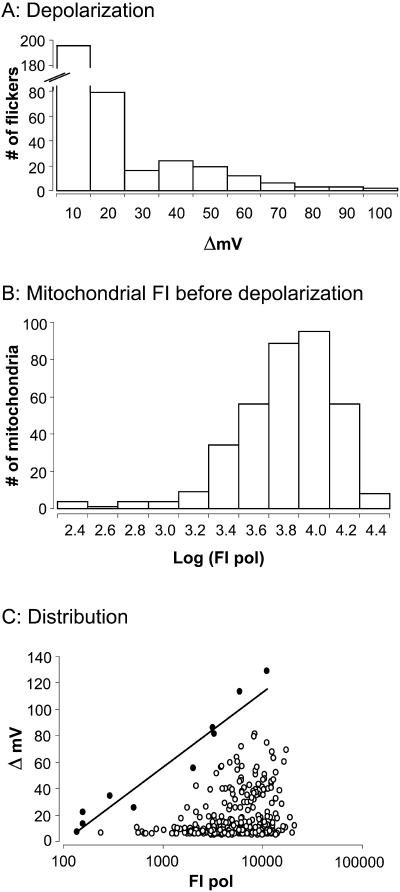
FIGURE 5.
Distribution of flicker amplitudes and resting FI. (A) The frequency with which depolarizations of different amplitudes occur. The distribution is skewed to smaller values. (B) The distribution of resting FI (FI before the onset of a flicker). Resting FI varies over a wide range, suggesting that mitochondria exist at different RΔΨm. (C) Amplitudes of mitochondrial flickers plotted as a function of the resting FI. Larger flicker amplitudes are associated with brighter resting FI. The correlation, though low, r2 = 0.03, is highly significant (P ≤ 0.0005). Solid circles are those points used for determination of maximum flicker amplitude (ΔVmax) at each RΔΨm·ΔVmax are plotted against resting FI before the flicker. The slope of the line is 58.1 mV per 10-fold change in FI m pol (r2 = 0.94).

