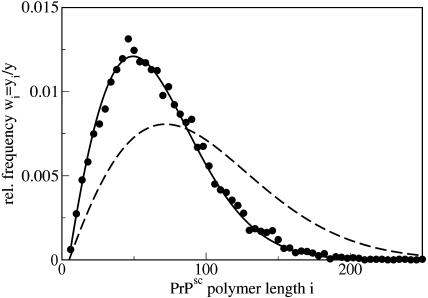
FIGURE 10.
Size distributions of PrPsc polymers for the full model, including x = x(t). The points display numerical simulations and the line shows the analytical result, Eq. 39. The parameters of the simulation are given in the caption of Fig. 7. For comparison, the dashed line shows the result for the simplified model with x(t) = λ/d = const. due to Eq. 26.

