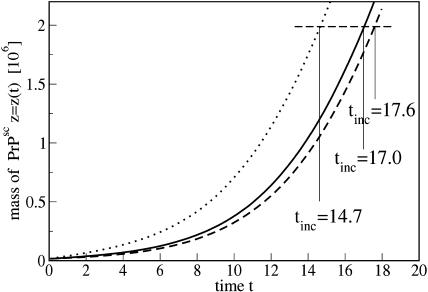
FIGURE 13.
Total mass of PrPsc molecules, z(t) over time for different initial size distributions as shown in Fig. 12. The initial total mass, z(0) = 16,000, is identical in all cases. The full line corresponds to the left plot in Fig. 12, the dashed line to the middle plot, and the dotted line to the filtered inoculation drawn in the right plot.

