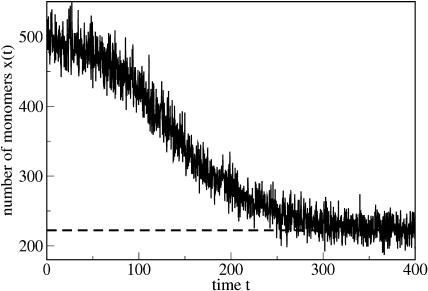
FIGURE 7.
Evolution of the number of monomers x = x(t). The simulation starts with x(0) = 100 monomers and relaxes within a very short time (which is not visible on the timescale of the figure) to x(t) ≈ 500. This corresponds to the number of monomers x0 = λ/d which provides the initial exponential growth. According to a complicated dynamics it eventually approaches its steady-state value xst = 222.211 given by Eq. 38 (dashed line). The parameters are n = 6, a = 0.05, b = 9 × 10⁻⁴, β = 0.015, λ = 200,000, and d = 400.

