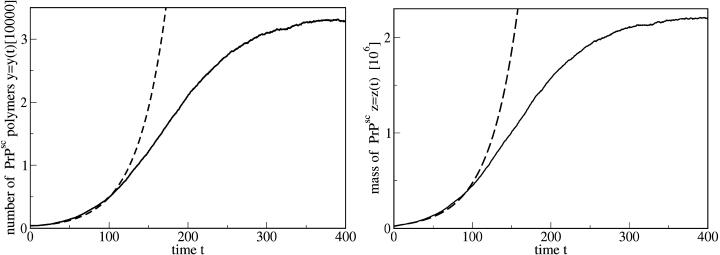
FIGURE 9.
Evolution of the number of PrPsc polymers y(t) (left) and the total mass of polymers z(t). For comparison, the dashed lines show the solution of the simplified set of equations, Eq. 14, with the exponents and coefficients given by Eqs. 16 and 17, respectively, with x0 = λ/d. The parameters of the simulation are given in the caption of Fig. 7.

