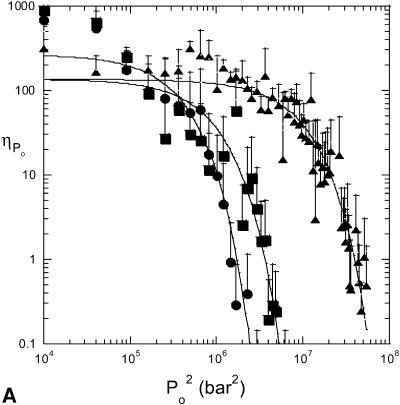
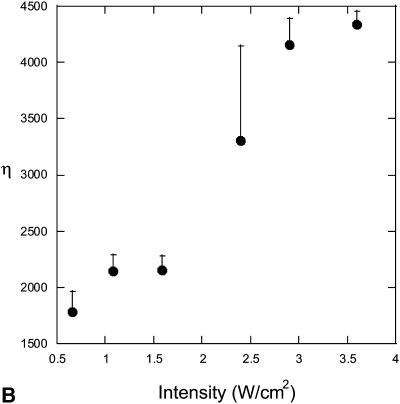
FIGURE 6.
(A) Distribution of collapse pressures at three ultrasound intensities: (•), 0.7 W/cm2; (▪), 1.6 W/cm2; and (▴), 2.9 W/cm2. The plot shows the dependence of the number of collapses ( ) with a collapse pressure between Po and Po + 100 bar. The distribution function fits experimental data well (r2 = 0.87, 0.71, and 0.89 for 0.7 W/cm2, 1.6 W/cm2, and 2.9 W/cm2, respectively). The error bars represent the standard deviation values (n = 4). (B) Dependence of the total number of collapse events (η) on ultrasound intensity. The error bars represent the standard deviation values (n = 4).


