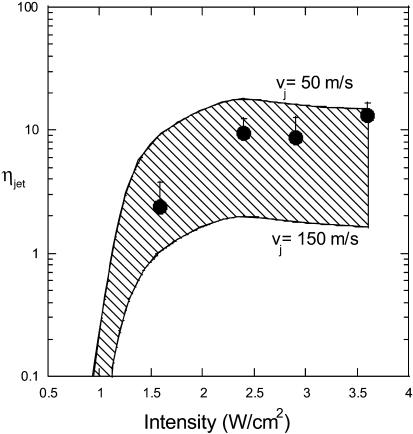
FIGURE 8.
The number of microjets per cm2 per second (ηjet) necessary to explain the experimental sonophoresis data as a function of ultrasound frequency and intensity. The shaded region corresponds to the area bounded by predictions in limiting cases made by assuming jet velocities of 50 m/s and 150 m/s. Filled circles show the experimental measurements of aluminum foil pits. Error bars correspond to one standard deviation.

