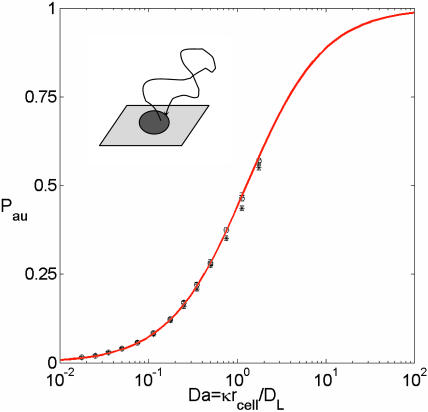
FIGURE 3.
Analysis of autocrine trajectories. The autocrine fraction depends on a single dimensionless group that combines the size of the trap, ligand diffusivity, and the rate constant on the trap surface: Da = κrcell/DL. The results of simulations are shown by symbols; the solid curve is given by Pau = Da/(Da + 4/π) (see text for details). Parameters of the simulations are rcell = 10 μm, kon = 108 M−1 min−1, σ = 0.1, 0.2, 0.4, and Rtotal = 104 − 5 × 10⁶.

