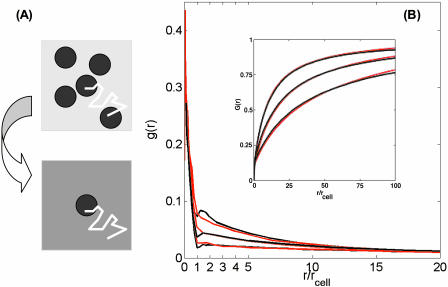
FIGURE 4.
(A) Schematic representation of the homogenization procedure used to analyze the paracrine trajectories. The trap-covered plane is approximated by the partially absorbing boundary condition. The surface reaction rate constant depends on the trap density and parameters of the trap, Eq. 3. (B) Comparison of the probability density functions and cumulative distribution functions found in simulations of the homogenized and original problems, shown by red and black curves, respectively. Parameters of the simulations are Da = 1.77 and σ = 0.1, 0.2, and 0.4 (bottom to top).

