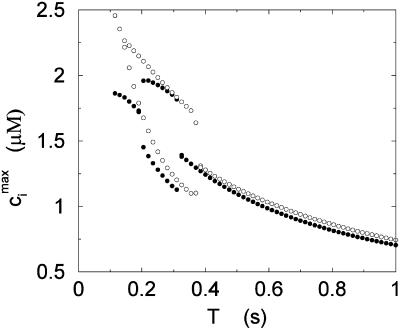
FIGURE 9.
Peak values of the bulk myoplasmic calcium concentration during steady-state pacing. The filled circles correspond to values predicted by the model ODEs. The open circles are found using the two-dimensional map described in the section “Map reduction with instantaneous nonlinear buffering”.

