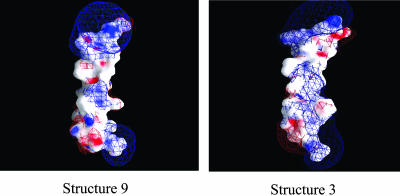
FIGURE 3.
Surface electrostatic potential of M2δ structures 9 (left) and 3 (right). The electrostatic potential (φ), calculated using DelPhi (Nicholls and Honig, 1991), is color-coded and displayed on the molecular surface using GRASP (Nicholls et al., 1991). Negative potentials (0 kT/e > φ > −20kT/e) are red, positive potentials (0 kT/e < φ < 20 kT/e) are blue, and neutral potentials are white. Three-dimensional equipotential contours are shown at 1 kT/e (blue mesh) and −1 kT/e (red mesh). The peptides are shown with their C-termini pointing down and their N-termini pointing up.

