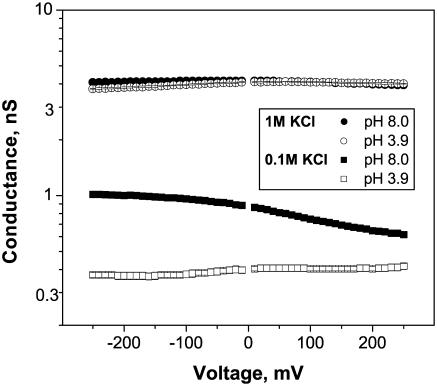
FIGURE 2.
Average conductance of a fully open channel as a function of applied voltage for different bathing solution concentrations: 1 M KCl (circles) and 0.1 M KCl (squares) at pH 8 (solid symbols) and pH 3.9 (unfilled symbols). Note that the curves have different asymmetry depending on the solution pH. When the voltage changes from −200 mV to 200 mV, the channel conductance grows at pH 3.9 and decreases at pH 8 for both KCl concentrations. Each curve was obtained as a result of averaging of conductance-voltage characteristics for 3–4 independent experiments with different channels.

