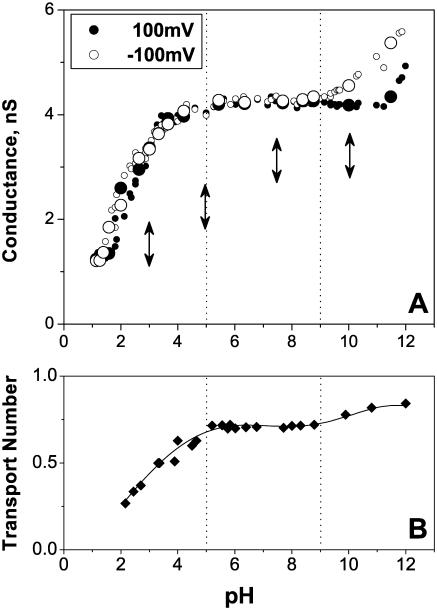
FIGURE 3.
(A) Average conductance of a fully open channel drops by a factor of 4 when bathing solution pH is shifted from pH 12 to pH 1. This is true for both positive (solid circles, 100 mV) and negative (unfilled circles, −100 mV) voltages. The data were obtained in four independent experiments with four different single channels. Only one channel was reconstituted in each case. Vertical arrows show initial pH values used for insertions. For example, enlarged circles show the data for the channel inserted at pH 10. Bathing solutions concentration was 1 M KCl. Dashed lines separate three regions of conductance behavior. (B) Ion selectivity of a fully open single channel, given as potassium transport number, t+, depends on solution pH. Three regions can be distinguished in the potassium transport number versus pH curve. The middle region (pH 5–pH 9) shows a constant, slightly cationic selectivity of OmpF; the “acidic” region demonstrates a gradual decrease of cationic selectivity and its inversion to anionic one. The “basic” region displays some growth in cationic selectivity.

