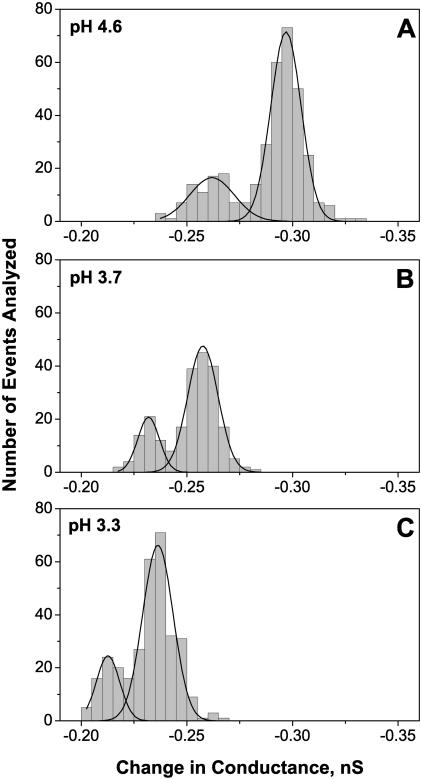
FIGURE 5.
Conductance histograms of the time-resolved stepwise transients induced by low pH (Fig. 4) at pH 4.6 (A), pH 3.7 (B), and pH 3.3 (C). Two peaks on each curve correspond to two clearly defined smaller conductance substates. The amplitudes of these peaks are equal to (0.26 ± 0.02) nS and (0.30 ± 0.01) nS for pH 4.6, (0.23 ± 0.01) nS and (0.26 ± 0.01) nS for pH 3.7, and (0.21 ± 0.01) nS and (0.24 ± 0.01) nS for pH 3.3. Within the statistical error, the ratio of areas under the peaks is independent of solution pH.

